Blob Generator
Organic shapes in one click, filled, outlined or with a gradient. Export as SVG or image.
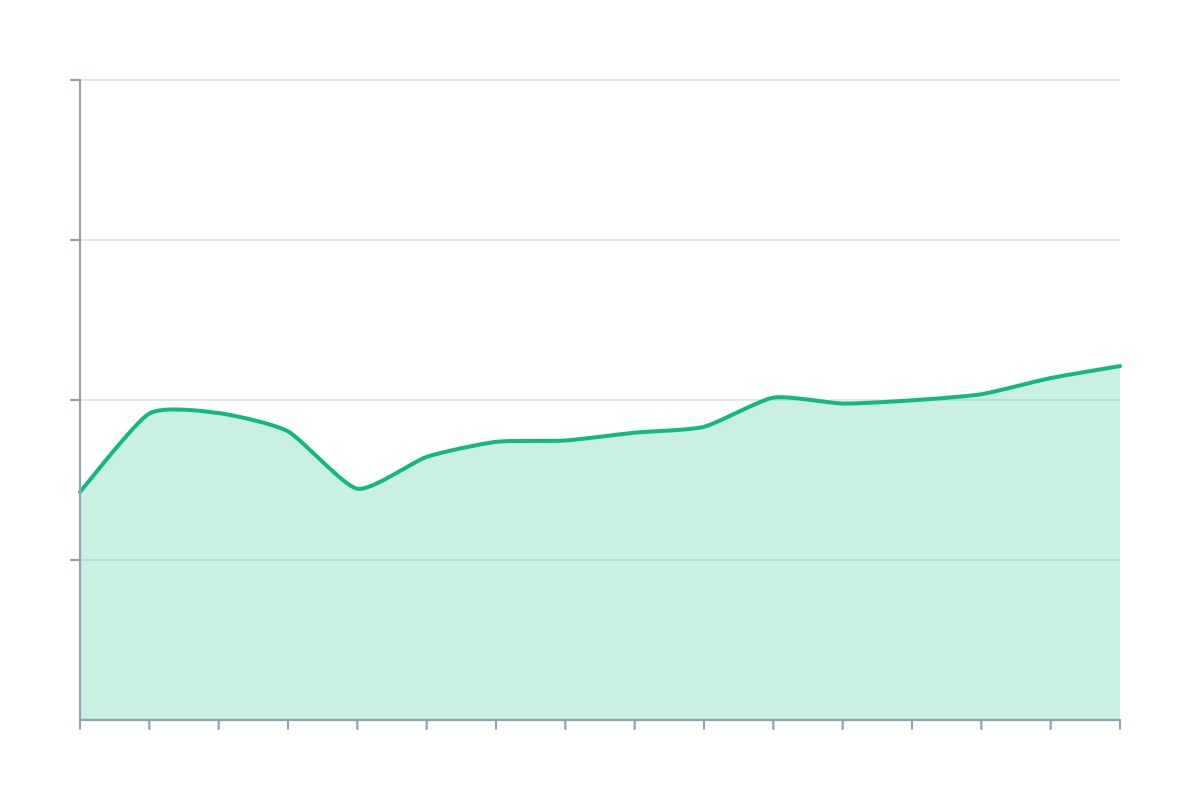
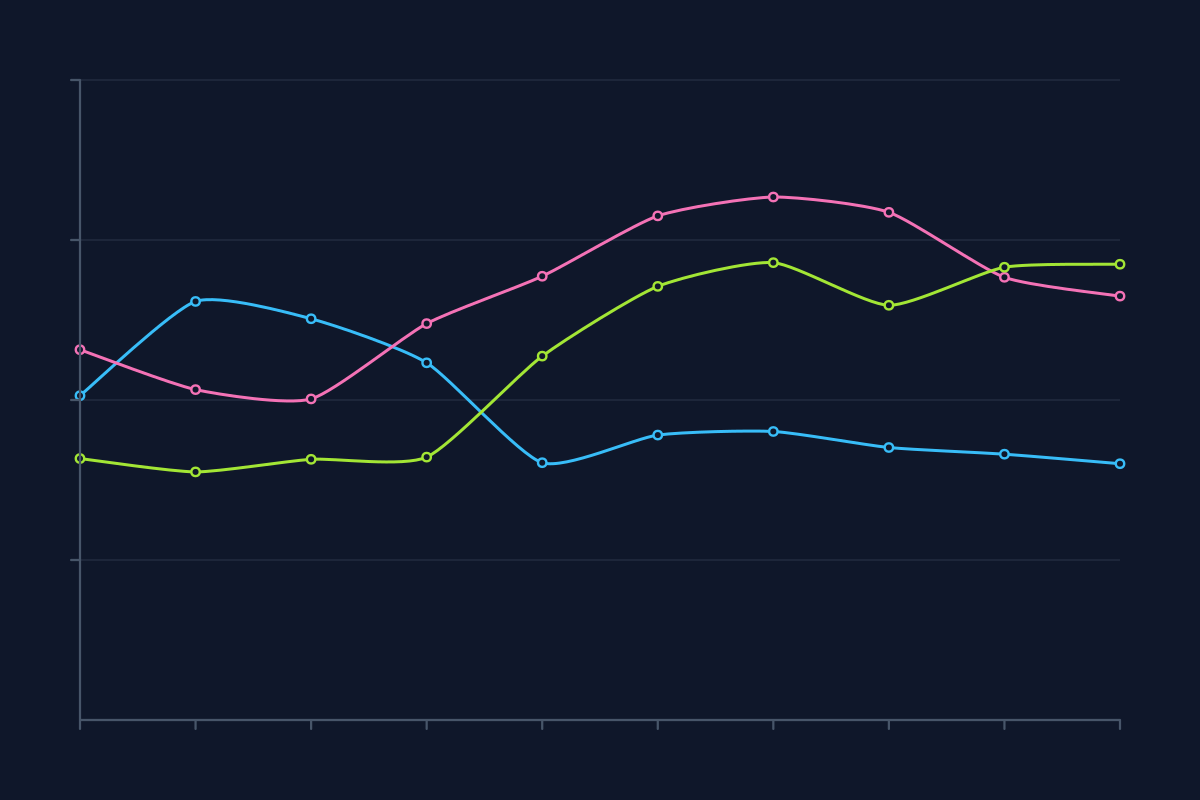
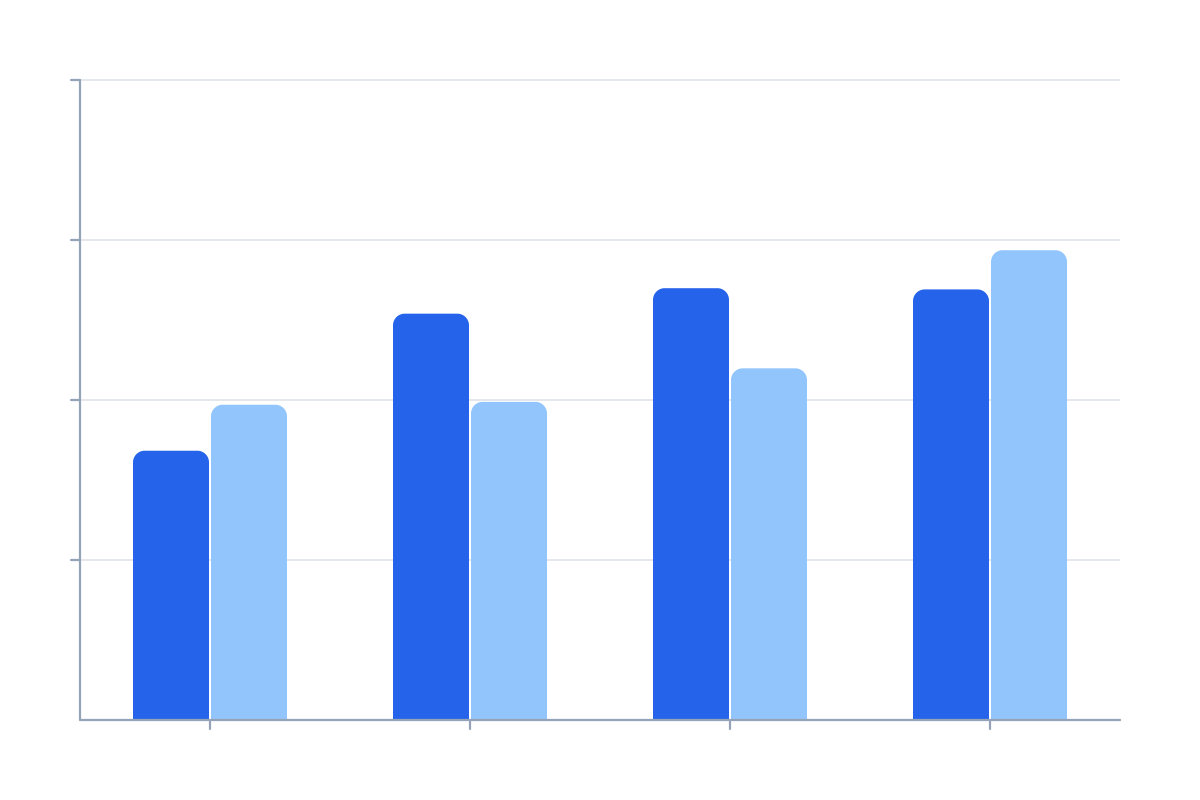
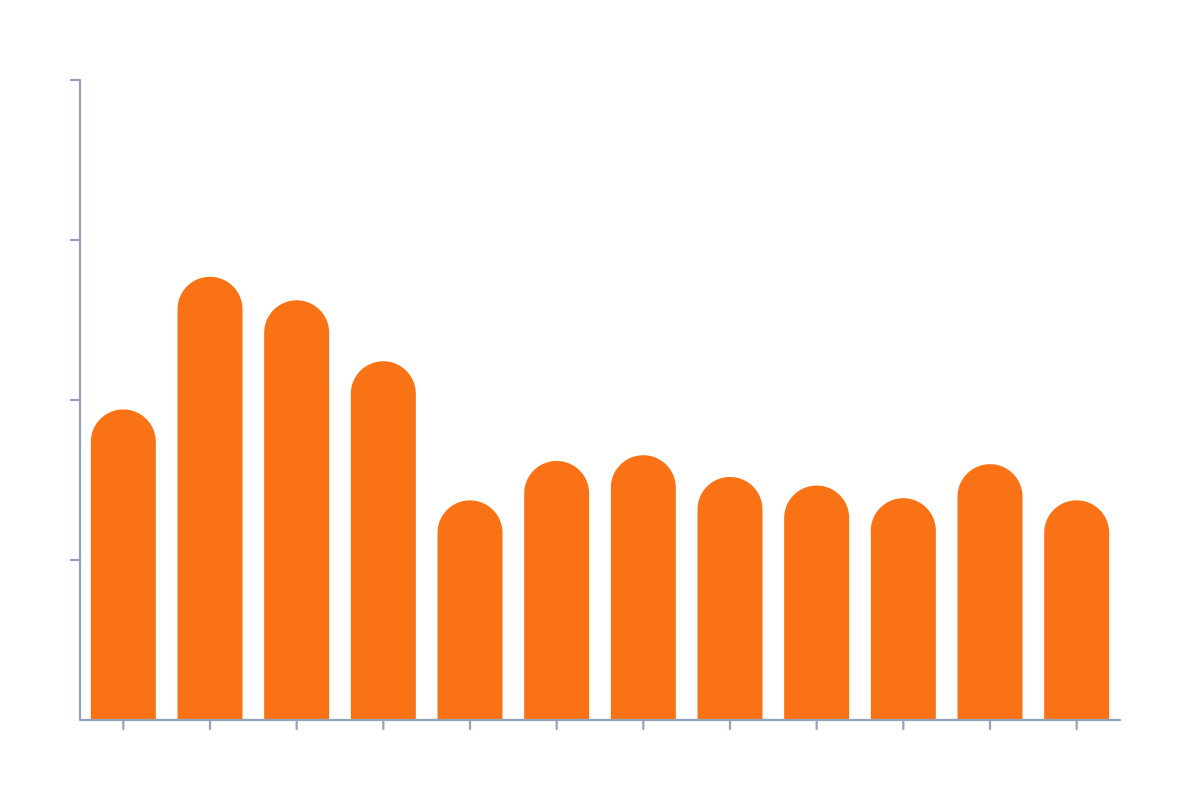
Open in editorPlaceholder charts with random data for mockups: lines, areas and bars. Export as SVG or image.
Open the generatorRuns right in your browser. Your graphics are made on your device.
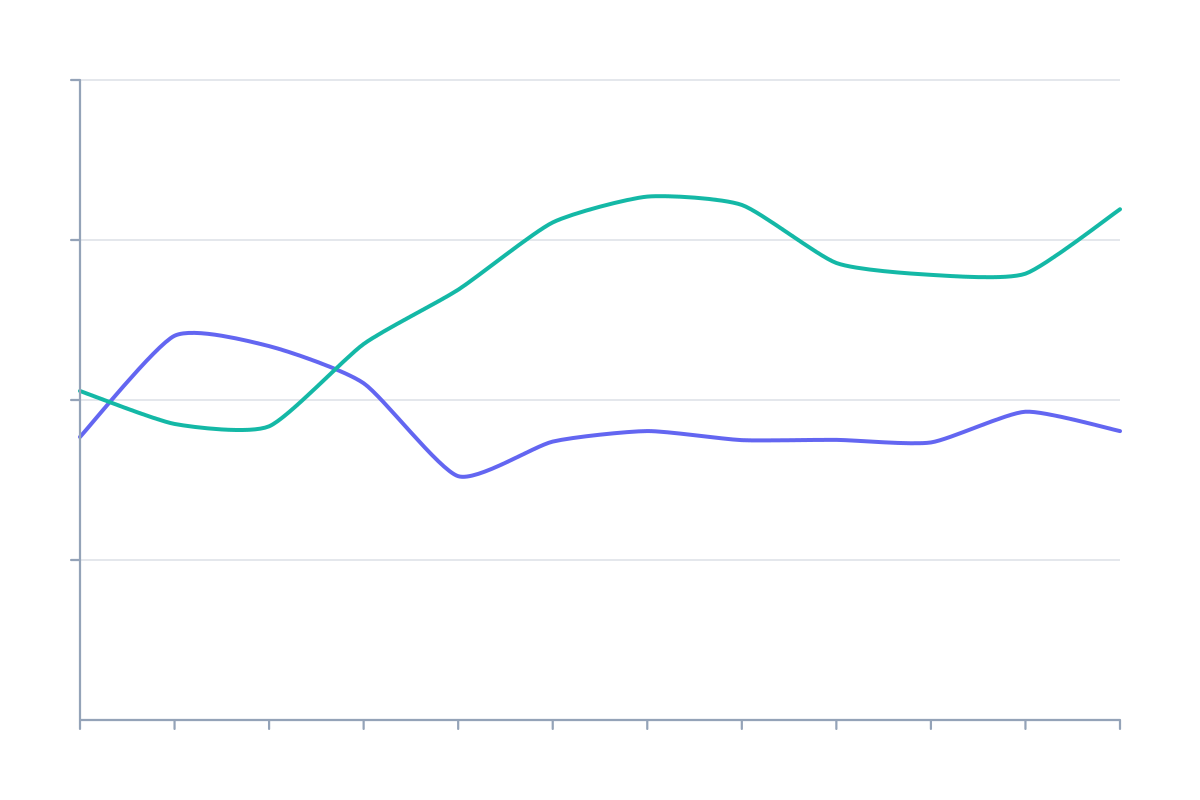
Pick a preset and it opens right in the editor, ready to adjust.
SVG charts are placeholder charts with random data. Use them in mockups, slides, landing pages and app designs when real numbers are missing or must not be shown.
Choose line, area or bars, set the number of series and data points, and adjust trend and volatility. Turn axes and grid lines on or off. Press Space for new data. Export as SVG, CSS or image.
Try the SVG Charts nowOrganic shapes in one click, filled, outlined or with a gradient. Export as SVG or image.
Open in editor
Layered waves for sections, headers and backgrounds. Export as SVG, CSS or image.
Open in editor
Several blobs at corners and edges that adapt to any canvas size. Export as SVG or image.
Open in editor
Hand-drawn looking squiggles, spirals, stars and zigzags as a background. Export as SVG or image.
Open in editor
A starry night sky with a color gradient, twinkling stars and sparkles. Export as SVG or image.
Open in editor
Linear, radial and conic gradients with smooth OKLCH transitions. Export as CSS, SVG or image.
Open in editor